


What is the quantity of pollutants emitted from the factories in our area? What does the PRTR report show for the pollution in our vicinity? Today, Thursday (08/28), the Ministry of Environmental Protection is publishing the National Air Emissions Inventory for 2024 and the PRTR for factories in Israel for 2024. The PRTR includes comprehensive information about pollutant emissions into the air, sea, ground, and water sources from factories and major pollution sources. The Ministry of Environmental Protection has published the PRTR every year since 2012.
The PRTR presents the pollutant emissions of 560 of the largest sources in Israel. The information is also presented geographically, allowing you to search for factories on a map. Furthermore, you can perform advanced data analysis by source and by pollutant, and compare data between different years.
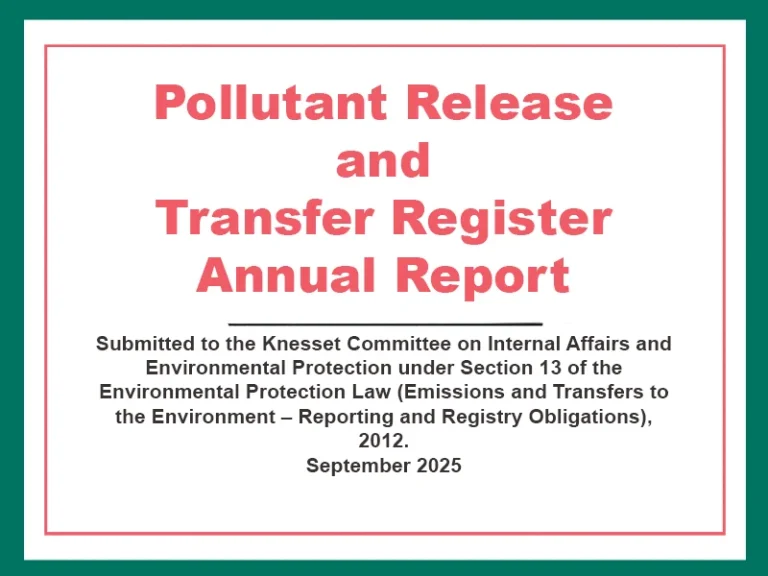
The PRTR
As in every year, the PRTR serves as a central tool for identifying trends in pollutant emissions and waste transfer in Israel. The Ministry of Environmental Protection uses the PRTR as a supporting tool for supervisory activities, decision-making, and policy formulation.
Additionally, the PRTR is designed to increase the transparency of environmental information in Israel, acting as a tool that provides the public with accessible data on pollutant emissions (to the air, sea, stream, and land) and waste transfers from all large factories. Because the structure of the registry is similar in OECD countries, it’s possible to make comparisons between them.
National Air Emissions Inventory
An information repository that presents the quantities of pollutants emitted into the air from various sources, including transportation, domestic uses, quarries, and waste burning, as well as from industrial sources not included in the PRTR. The inventory, which has been published since 2015 (and annually since 2021), is intended to provide supplementary information on air emissions in Israel, in addition to the factories’ reports to the PRTR. Its purpose is to create a complete and comprehensive picture of air pollutant emissions, including from sectors that do not report to the PRTR.
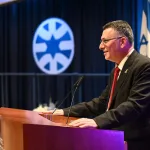
Idit Silman, Minister of Environmental Protection: “The 2024 PRTR data illustrates Israel’s progress in reducing pollutants and focusing our efforts in the right areas – reducing coal use, transitioning to renewable energy, and transparently disclosing data to the public. Alongside these achievements, the report highlights the remaining challenges: the increase in greenhouse gas emissions, carcinogenic substances, and waste burning. The Ministry will continue to act decisively to protect public health and the environment”.
Key Findings
Decrease in Major Pollutant Emissions
Following the decrease in the use of coal for electricity generation, a downward trend in nitrogen oxides and sulfur oxides emissions continues, according to the PRTR (6%-13%).
Increase in Greenhouse Gas Emissions
A 2% increase compared to 2023, from carbon dioxide, methane, and primarily from fluorine gases (a sharp increase of 30%) due to a temporary provision for the Iron Swords War. The Montreal Protocol Implementation Regulations permit the import of cooling gases for security purposes or for the protection of human life.
Increase in Carcinogenic Substances and NMVOC
In 2024, the PRTR recorded a 16% increase in factory reports for these two types of pollutants, particularly from industrial plants and landfills. The increase is due, in part, to a decrease in the rate of biogas collection at landfills, along with a rise in emissions from bio-generators at manure digestion facilities and WWTPs (Wastewater Treatment Plants). In the area of NMVOC, an increase in emissions was recorded from the Solbar Protein Products plant in Ashdod, C.L.P. Industries Ltd. in the Negba area, and Rotem Amfert in the Negev.
Increase in Particulate Matter (PM)
Although there was no actual change in emissions in the inventory, a sharp increase of up to 29% was recorded due to a new inventory of forest fires and an update of calculations.
External Cost
In 2024, the economic damage from the effects of air pollution on health and the environment was estimated at 37 billion ₪. This marks a decrease of about 2% compared to 2023. By sector, transportation is responsible for 29% of the total cost, electricity production for 28%, and industry for 13%. In terms of pollutant types, 45% of the external cost was caused by greenhouse gas emissions, 28% by nitrogen oxides, and an additional 13% by respirable particles. 80% of the cost from PRTR reporters is attributed to the 20 largest factories in Israel.
Indirect Effects of the Iron Swords War
The war has led to changes in economic activity, which have also resulted in environmental impacts. Among other things, a significant decrease was recorded in port activity and in the construction sector, alongside a rise in forest fire incidents. Due to a decrease in the number of vessels visiting Israeli ports and the duration of their stay, a reduction of 34% in emissions was recorded. On the other hand, the areas of forest that burned in 2024 were more than three times larger than those in 2022.
Additional Data
| Explanations for Trends | 2024 Relative to 2023 | Air Emissions |
| Decrease in emissions from electricity production and vessels in ports. A change in calculation for emissions from construction and engineering equipment (CEE) caused an overall decrease of 19% | -6% | Nitrogen Oxide |
| Decrease in emissions from electricity production and vessels in ports | -6% | Sulfur Oxides |
| Decrease in emissions from electricity production and vessels in ports | No change | Decrease in emissions from electricity production and vessels in ports |
| With the new inventory for forest fires and updated calculations for road transportation and CEE, there was an increase of 24% | No change | PM2.5 Particles |
| Increase in emissions from municipal waste burning and bio-generators (landfills, WWTPs, manure digestion) | +2% | Carcinogenic Substances |
| +3% | Non-Methane Volatile Organic Compounds (NMVOC) | |
| Increase in electricity production from fuels and in transportation | +2% | Total Greenhouse Gases |
| No change | Increase in electricity production from fuels and in transportation | |
| Increase due to a temporary provision to the Montreal Protocol Implementation Regulations that permits the import of fluorine gases for security purposes or for the protection of human life | +30% | Fluorine Gases |
| -2% | External Cost of Air Emissions |
| Trend Since 2012 | 2024 vs. 2023 | Air Emissions |
| 74%- Reduction in coal use for electricity production | 13%- Reduction in coal use for electricity production | Nitrogen Oxides |
| 87%- Reduction in coal use for electricity production. | 7%- Reduction in coal use for electricity production | Sulfur Oxides |
| 73%- Reductions in coal use for electricity production and at Rotem Amfert Negev, along with an update to calculation guidelines for chicken coops | 6%- Reductions at Rotenberg Power Station, Rotem Amfert Negev, quarries, and landfills | Sulfur Oxides |
| 7%+ Reductions in coal use for electricity production, at gas production platforms, and in industry. Increase in biogas emissions from mixed waste landfills and emissions from bio-generators at WWTPs and landfill | 16%+ Decrease in the rate of biogas collection at landfills, and an increase in emissions from bio-generators at manure digestion facilities and WWTPs | Suspected or Known Human Carcinogens |
| 11%- Reductions following the implementation of requirements in air emission permits, primarily in the chemical sectors | 16%+ Increase in emissions from Solbar Protein Products in Ashdod, C.L.P. Industries in Negba, and Rotem Amfert Negev, and an increase in landfill gas emissions | Non-Methane Volatile Organic Compounds (NMVOC) |
| Trend Since 2012 | 2024 vs. 2023 | Air Emissions |
| 25%- A reduction in coal use for electricity production and an increase in renewable energy | 0.2%+ A slight increase in electricity production from fuels | Carbon Dioxide |
| In the 2023 reports, updates were made to the calculation guidelines for biogas emissions from mixed waste landfills | 9%+ A reduction in biogas collection at mixed waste landfills | Methane |
| 19%+ | 9%+ | Fluorine Gases |
| 1%- | External Cost of Air Emissions |
| Trend since 2021 | 2024 vs. 2023 | Topic |
|---|---|---|
| 95%- | 2%+ | Fuel Oil Consumption |
| 221%+ | 1%- | Natural Gas Consumption |
| 0.3%+ | Emissions from Malfunctions | |
| 3%+ (Since 2014) | 4%- Most likely due to the closure of Veolia’s Mashua compost plant | Mixed Waste Recycling |
| 194%+ (Since2014) | 5%- In the fourth quarter of 2023, activity was halted at more than 50% of construction sites in Israel and only returned to full activity at the end of 2024 | Construction Waste Treated at Transfer Stations |
Greenhouse Gases
In 2024, the quantity of greenhouse gas emissions in Israel increased by 2% compared to 2023, reaching 79 MtCO2e. The 1.7 MtCO2e rise in emissions in 2024 was primarily due to an increase of 1 MtCO2e in fluorine gas emissions, which are used for cooling, semiconductor production, fire extinguishing systems, and magnesium production. This increase stems from a temporary provision in the Montreal Protocol Implementation Regulations that permits the import of fluorine gases for security purposes or the protection of human life. Additional increases were also seen in electricity production from fuels and in transportation.
The volume of electricity production increased by 5% in 2024, but the volume of electricity from renewable energy sources rose by 22%. As a result, there was only a slight 0.5% increase in the volume of electricity production from fuels. In 2024, the rate of electricity production from renewables was 14.7%. At 85%, Israel’s rate of electricity production from fuels is the highest among OECD countries.
External Cost of Air Emissions
An external cost expresses the negative external impacts on human health and the environment in monetary value. According to the 2024 inventory, the external cost of air pollutant emissions in Israel is 37 billion ₪. Of this, 20.2 billion ₪ is from local pollutants and 16.7 billion ₪ is from greenhouse gases.
The external costs of air emissions in Israel decreased by 2% compared to 2023, at 2024 prices (a decrease of 860 million ₪). The external cost of air emissions from PRTR reporters in 2024 is 15.2 billion ₪. In 2024, there was a 1% reduction in the external cost from PRTR reporters, which is approximately 170 million ₪. The calculation was made according to the updated external costs (as of December 31, 2024) in the document “The Green Book: Assessment and Measurement of Environmental Costs – External Costs of Air Pollutants and Greenhouse Gases” on the Ministry of Environmental Protection’s website.
The following are the 20 factories with the highest external cost from air pollutant emissions (they constitute 4% of PRTR reporters) – these facilities are responsible for 80% of the total external cost in the PRTR:
| Rate of Total Cost Change from 2023 (at 2024 prices) | 2024 External Cost (million ₪): GHG, from Total Cost | 2024 External Cost (million ₪): Total Cost | Local Authority | Factory | # |
| 10%- | 1,523 | 3,180 | Hadera | Israel Electric Corp. – Orot Rabin | 1 |
| 5%- | 541 | 1,219 | Ramla | Nesher Israeli Cement Enterprises | 2 |
| 11%- | 924 | 1,180 | Ashkelon | Israel Electric Corp. – Rotenberg | 3 |
| 17%+ | 542 | 775 | Gezer | Israel Electric Corp. – Gezer | 4 |
| 8%- | 382 | 572 | Ashdod | Eshkol Energy Production | 5 |
| No Change | 336 | 506 | Ashkelon | Doral Energy | 6 |
| 17%+ | 353 | 492 | Neot Hovav | Ramat Hovav Power Station Limited Partnership | 7 |
| 8%+ | 330 | 431 | Hof HaCarmel | Israel Electric Corp. – Hagit | 8 |
| 1%+ | 335 | 465 | Haifa | Bazan – Oil Refineries Ltd | 9 |
| 1%+ | 416 | 448 | Yoav | Dalia Power Station | 10 |
| 15%+ | 70 | 433 | Tamar | Rotem Amfert Negev | 11 |
| 9%+ | 339 | 429 | Haifa | Israel Electric Corp. – Haifa | 12 |
| 3%- | 255 | 361 | Tamar | OPC Rotem | 13 |
| 4%- | 220 | 313 | Tamar | Dead Sea Works | 14 |
| 37%+ | 267 | 291 | Hof HaCarme | Hagit Mizrah Power Station Operation and Maintenance | 15 |
| 24%+ | 97 | 273 | Ashdod | Ashdod Oil Refinery | 16 |
| 21%- | 175 | 226 | Be’er Tuvia | IPM Be’er Tuvia | 17 |
| 15%+ | 192 | 211 | Tamar | Efeh Landfills | 18 |
| 18%- | 163 | 206 | Jezreel Valley | MRC Alon Tavor Power Ltd. | 19 |
| 248%+ | 134 | 182 | Hedera | Israel Electric Corp. – Nativ Ha’Or | 20 |
Updates to Air Emissions Calculation Methods in the 2024 Inventory
The following are the main changes in the 2024 National Air Emissions Inventory:
Road Transportation
Three updates were made:
The source for annual mileage data was updated to the Central Bureau of Statistics (CBS) instead of the Ministry of Transport, as the CBS refines the data. However, the data from the CBS is received with a one-year delay.
An update was made to emission factors – the new factors are up-to-date and come from a model used in most European Union countries.
The inventory now also includes hybrid and electric vehicles.
Non-Road Transportation (Heavy Construction Equipment) – An update was made to the quantity of diesel consumption by heavy construction equipment. The old method’s quantity was based on a survey of transport companies, while the new method is based on excise tax refunds for heavy construction equipment. The new quantity is about half of the previous amount, and emissions have decreased accordingly.
Wildfires – a new inventory based on satellite images received from the Israel Nature and Parks Authority.
Haifa Bay
In the PRTR reports for Haifa Bay, emissions of most major pollutants increased in 2024 at a rate of 3% to 45%. Cumulatively, however, there have been reductions of all major pollutants at a rate of 57% to 94% since 2012.
There was a 45% increase in suspected or known human carcinogens in Haifa Bay in 2024, following a rise in emissions from the Haifa WWTP (biogas combustion engine sampled for the first time), the Haifa Power Station, and Carmel Olefins. Cumulatively, however, there has been an 87% reduction since 2012.
In 2024, NMVOC emissions increased by 3% (with increases at Carmel Olefins, the oil refinery, and the Haifa WWTP), while cumulatively since 2012, there has been a 90% reduction in air emissions.
In PM10 particles, there was a 44% increase in 2024, originating from the Haifa Power Station. Cumulatively, however, there has been a 61% reduction since 2012.
In nitrogen oxides, there was a 9% increase in 2024 following the activity of the Haifa Power Station. Cumulatively, however, there has been a 57% reduction since 2012.
Following a professional review by the Haifa Bay Union of Municipalities for Environmental Protection, the Ministry of Environmental Protection has recently been examining the union’s claims that the benzene emission report from the Gadiv plant, part of the Bazan Group, is incomplete and that the emissions are higher than what’s being reported. An announcement will be published on the findings of the examination.
The Industrial Zones in Northern Ashdod
In the industrial zones of northern Ashdod, the following trends were observed in 2024:
For suspected or known human carcinogens, there was a 17% reduction in 2024, mainly due to reductions in emissions from Adama Agan and HaKuranas Lead Works. Cumulatively, there has been an 84% reduction since 2012.
For NMVOC, there was an 8% increase in emissions in 2024 (due to a 45% increase in emissions from Solbar Protein Products). Cumulatively, there has been an 8% reduction since 2012. It should be noted that in both 2024 and 2025, the Solbar plant had exceedances in chimney samplings for Hexane and TOC, and as a result, the Ministry initiated enforcement proceedings against the Solbar plant.
For PM10 particles, there was a 16% increase in 2024, originating from the Eshkol Power Station and the Ashdod Oil Refinery. Cumulatively, there has been a 77% reduction since 2012.
For nitrogen oxides, there was a 32% reduction in 2024 following a decrease at the Eshkol Power Station. Cumulatively, there has been a 76% reduction since 2012.
For sulfur oxides, there was a 101% increase in 2024, following the findings of a surprise chimney sampling at the Ashdod Oil Refinery. Cumulatively, there has been a 93% reduction since 2012.
Discharge of Salts in WWTP Effluents
85% of WWTP effluents are used for agricultural irrigation, and thus the salts contained in the effluents reach agricultural soils.
In 2024, the amount of salts in WWTP effluents increased by 13%, reaching 209 thousand tons of chlorides and sodium. The increase is explained by a rise of about 70% in the pumping of relatively salty Kinneret water compared to 2023, while the amount of desalinated water was reduced by 7%. Additionally, there was a 5% increase in domestic and industrial water consumption.
Since 2016, there has been a cumulative increase of 41% in the amount of salts in WWTP effluents. This is explained by a 19% increase in domestic and industrial water consumption since 2016 and an increase in the pumping of Kinneret water, as most winter seasons in recent years have been rich in rainfall.
Emissions During Malfunction
In 2024, 77 factories, which constitute about 14% of all PRTR reporters, reported emissions or discharges due to a malfunction. There was a 1% increase in these emissions and discharges during malfunctions in 2024. The largest emissions occurred at the Karish platform of Energean Israel Ltd., Phoenicia Glass Works in Yeruham, and Dead Sea Works.
Effects of the Iron Swords War
This report does not present the direct effects of the fighting, but rather only the indirect effects.
Vessels in Ports – Due to the Iron Swords War, the number of vessels visiting Israeli ports decreased, and the average duration of a vessel’s stay in port was reduced. As a result, emissions decreased by 34%.
Forest Fires – The area burned by forest fires in 2024 is three times larger than the area that burned in 2022, and is partly attributed to the war on the northern confrontation line.
Fluorine Gases – In 2024, there was a 30% increase in fluorine gas emissions (an increase of 1 MtCO2e), which are used for cooling, semiconductor production, fire extinguishing systems, and magnesium production. This was due to a temporary provision to the Montreal Protocol Implementation Regulations that permits the import of fluorine gases for security purposes or for the protection of human life.
Construction Waste – In 2023-2024, there was a decrease of about 10% in the amount of construction waste treated at transfer stations and recycling plants. This decrease is attributed to the Iron Swords War. According to data from the Central Bureau of Statistics (CBS), activity was halted at more than 50% of construction sites in Israel in the fourth quarter of 2023 and only returned to full activity at the end of 2024.